5 EHR Metrics to Improve Revenue Cycle & Healthcare IT
Your EHR generates mountains of data but only a handful of metrics tell you whether your revenue cycle is healthy, your clinicians are efficient, and your organization is audit ready. Here's how to cut through the noise.
Most healthcare organizations today are drowning in data. Every encounter, every claim submission, every ERA posting, every patient portal login generates a data point. The challenge isn’t accessing its signal versus noise. Which numbers predict problems before they compound? Which ones reveal whether your technology stack is working for your organization, or quietly working against it?
Healthcare IT professionals occupy a unique vantage point in this challenge. They sit at the intersection of clinical systems, payer integrations, and financial operations, which means they’re often the first to see when something is going wrong, and the last to get credit when things run smoothly. That vantage point is only useful if you’re watching the right gauges.
After working across revenue cycle management, EDI claim workflows, EHR integrations, and clearinghouse configurations, a clear pattern emerges: five metrics consistently separate organizations that are in control from those perpetually reacting to problems that could have been caught weeks earlier.
These aren’t vanity metrics or dashboard decoration. Each one connects directly to cash flow, compliance exposure, or operational throughput. More importantly, each one is actionable — when it moves in the wrong direction, there’s a specific place to look and a specific thing to fix.
There was a time when “voice recognition in healthcare” simply meant dictating into a microphone and hoping the system got your words right. Anyone who used those early tools remembers the frustration misheard terms, constant corrections, and workflows that felt slower than typing.
Fast forward to today, and the landscape has changed dramatically.
Voice recognition in healthcare has evolved across three clear stages:
- Dictation → “Say it, get text”
- Transcription → “Capture conversations”
- Ambient + AI Structuring → “Generate clinical notes automatically”
- Only the third stage actually moves the needle.
Voice is no longer just an input method. It’s becoming the primary interface for clinical documentation. But not everything you hear in the market actually works in real clinical settings. The gap between demos and day-to-day usability is still very real.
So let’s cut through the noise and talk about what genuinely works today in EHRs when it comes to voice recognition for clinical notes.
Here is something no vendor brochure will say plainly: most healthcare organizations in 2026 are still one phishing email away from a serious breach. The tools have improved. The attackers have improved faster.
Electronic Health Records hold a patient’s most sensitive information — diagnoses, medications, mental health notes, financial data. Protecting that data is not just a legal requirement. It is a fundamental duty to the people who trust you with it.
This guide cuts through the noise. We will cover the real threats, where EHR security breaks down, what HIPAA demands in 2026, and the practical steps you can take starting this quarter.
A patient’s medical record is worth up to 40 times more than a stolen credit card on the dark web. Cybercriminals know this. Does your security posture reflect it?
First Pass Rate (FPR)
First Pass Rate measures the percentage of claims accepted and paid on the very first submission no rejections, no rework, no resubmissions. It is the single clearest indicator of how well your EHR configuration, coding logic, and clearinghouse mapping are aligned with payer requirements.
Why is it the leading indicator
FPR is predictive, not retrospective. By the time Days in AR start creeping upward, you already have weeks of rework accumulating in your billing queue. FPR tells you that something is broken right now — before it becomes a cash flow problem next month.
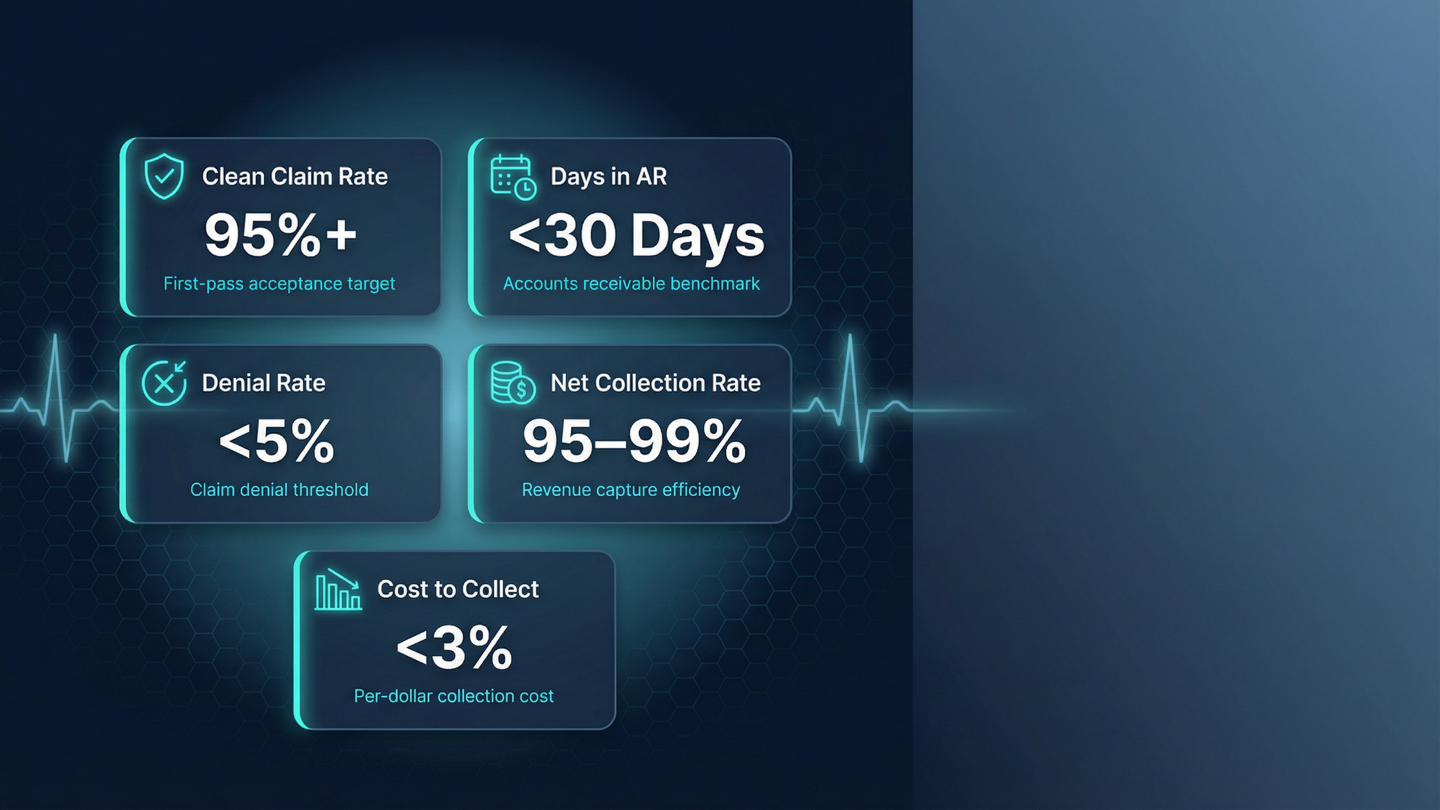
Industry benchmark is 95% or above. A healthy practice operating player96–98% FPR has well-tuned eligibility verification, clean charge capture, and EDI configurations that match the companion guide requirements of each payer they work with. Anything below 90% is a flashing red light not a warning sign, a flashing red light.
What does low FPR mean?
Every rejected or denied claim on first pass represents a failure somewhere in your system and the root cause is almost never the clinician. Common culprits include misconfigured ISA segment fields that don’t match a payer’s trading partner specifications, eligibility data that wasn’t verified at the time of scheduling, modifier combinations that the payer’s adjudication system rejects automatically, or NPI type mismatches in loop 2010AA or 2010BB of the 837P file.
Each rework cycle costs $25–$50 in operational overhead per claim, before your account for the cash flow impact of delayed reimbursement. A practice submitting 500 claims per week with an 88% FPR is generating approximately 60 rework claims weekly that’s $1,500 to $3,000 in avoidable administrative cost, every single week.
Review FPR weekly, segmented by payer. A sudden drop in one payer’s first-pass acceptance rate almost always points to a configuration change either the payer updated their requirements, or something in your EDI setup shifted.
Days in Accounts Receivable
Days in AR measures the average time between service delivery and payment receipt. It’s the primary financial health metric of your revenue cycle — a lagging indicator that captures the cumulative effect of everything upstream: charge capture timing, claim submission speed, clearinghouse processing, payer adjudication timelines, and ERA posting accuracy.
Reading the number correctly
The target for most ambulatory and specialty practices is under 40 days. Hospital outpatient departments and complex specialties with high authorization burdens may run 45–55 days without it indicating a problem. The number only becomes meaningful in context compare it against your own historical baseline and against specialty-specific benchmarks, not a generic industry average.
Critically, Days in AR is a lagging indicator. By the time it rises from 38 to 52 days, you may have two or three months of systemic billing problems already baked in. This is why you can’t manage revenue cycle health with AR days alone you need it paired with a leading indicator like FPR.
What's hiding in your AR bucket
High AR days are often misdiagnosed as a payer problem. The root cause is frequently internal: ERA files not being auto posted due to a clearinghouse configuration error, denial appeals sitting in a worklist with no assigned owner, secondary billing not triggering automatically after primary adjudication, or missing prior authorization documentation that should have been captured in the EHR at the time of scheduling.
Segmenting AR by aging bucket (0–30, 31–60, 61–90, 90+) and by payer reveals where the blockage is. A high concentration in the 61–90-day bucket for a specific payer suggests a denial pattern or a contract dispute. A spike in the 0–30 bucket often means claims aren’t getting submitted in a timely way a workflow or staffing issue rather than a payer issue.
Chart Completion Rate
Chart Completion Rate tracks the percentage of encounter notes signed and finalized by providers within your organization’s defined completion window typically 24 to 48 hours post-visit. It sits at the intersection of clinical quality, compliance, and billing operations, making it one of the most important metrics that most organizations underinvest in tracking.
Why is this usually an EHR problem, not a provider problem
Healthcare IT professionals should pay particular attention to the pattern of incomplete charts not just the rate. If incompletion is concentrated among a specific specialty, a specific encounter type, or a specific time of day, it points to a workflow design problem rather than a provider behavior problem.
EHRs that require providers to navigate multiple screens to complete documentation, that surface alerts and required fields at inconvenient moments, or that don’t support mobile completion for providers seeing patients across multiple locations, will consistently produce high chart lag. The metric is a proxy for EHR usability friction. When chart completion drops, before escalating to clinical leadership, ask what changed in the EHR environment in the past 30 days.
Denial Rate by Payer
Denial Rate by Payer measures the percentage of submitted claims denied, broken out by individual payer not in aggregate. The distinction matters enormously. An organization with a 6% aggregate denial rate may have three payers running at 2%, two at 5%, and one at 18%. The aggregate hides the outlier. The outlier is where the problem and the solution actually lives.
Why segmentation is everything
Healthcare IT teams managing EDI configurations know that payer-specific issues are almost always configuration-specific issues. A payer denying claims at 18% is not doing so randomly there is almost certainly a pattern. Denials concentrated on a specific procedure code suggest a coverage policy change in that payer’s adjudication rules. Denials concentrated on claims from a specific rendering provider suggest an NPI or credentialing problem. Denials distributed broadly across claim types suggest a structural EDI issue a field value that doesn’t match the payer’s companion guide requirements.
277CA transaction files, when parsed correctly, give you the denial reason codes at the claim and line-item level. Mapping those codes against your payer-segmented denial rate tells you not just how many claims are failing, but why and for which payer that reason code is disproportionately appearing.
The configuration fix mindset
Most high denial rates from specific payers are fixable at the source not through manual appeals, but through upstream configuration changes. A correct ISA06 qualifier and ID in your EDI trading partner setup eliminates an entire category of rejections. A correct service facility NPI in loop 2310C eliminates another. The goal of tracking denial rate by payer is to identify which configuration element needs to change so that the same error stops recurring on every new claim.
Establish a denial threshold for escalation of any payer running above 8% should trigger an immediate review of the trading partner configuration, the companion guide requirements for that payer, and the specific denial codes driving the rate. Don’t wait for the monthly report.
Patient Portal Adoption & Activation Rate
Patient Portal Adoption Rate tracks the percentage of patients who have activated their portal account and logged in at least once within the past 90 days. It is distinct from enrollment alone a patient who received an activation email but never completed setup is not an active portal user and does not count for reporting purposes.
The MIPS reimbursement connection
CMS requires a minimum 50% patient activation rate to satisfy the Promoting Interoperability performance category under MIPS. This category accounts for a significant portion of your Quality Payment Program score, which directly affects Medicare reimbursement rates. Falling below the threshold doesn’t just cost you points it can trigger a negative payment adjustment that applies to all Medicare claims for the following year.
High-performing organizations are achieving 30-40% 90-day active user rates, meaning patients who activate and then return repeatedly. That sustained engagement rate is what drives value it enables asynchronous communication, reduces no-show rates through automated reminders, and creates a documented record of patient outreach that supports care gap closure.
Why this is an IT and workflow problem
Low portal adoption is almost never a patient motivation problem at its root. It is most commonly an onboarding friction problem. If the activation flow requires patients to navigate more than three steps, remember a temporary password, or complete identity verification on a device that isn’t mobile-optimized, activation rates will suffer.
The fix belongs to healthcare IT as much as to patient education teams. Evaluate the activation flow from the patient’s perspective specifically on a mobile browser, since that’s how most patients will attempt to access it. Identify where drop-off occurs in the enrollment funnel. Test whether the portal is integrated into the care workflow in a way that gives patients a reason to return: can they view their visit summary? Request for prescription refills. Message their care team. A portal that patients activate but never use is not a patient engagement success.
Language access is also a technical implementation question. If your patient population includes significant non-English speakers and your portal does not support language selection or automated translation, adoption will plateau. That is an EHR configuration and vendor capability question one that belongs in your next contract review.
Making them visible at the right cadence
The organizations that manage these metrics well share one thing in common; they’ve made them visible to the right people at the right frequency. FPR and payer-level denial rates should be reviewed weekly by whoever owns EDI configurations and clearinghouse relationships not monthly or weekly. Movements of even two or three percentage points week-over-week signal something worth investigating before it compounds.
Completion Rate belongs to weekly clinical operations reviews, ideally surfaced directly to department heads and care team leaders not buried in a report that reaches leadership 30 days after the fact. Days in AR and its aging bucket breakdown are monthly conversations that belong in revenue cycle leadership reviews, alongside denial trend analysis.
Portal Adoption is a quarterly metric that should bridge three groups: IT, clinical leadership, and patient engagement or care management. The decision to fix a broken activation flow, add language support, or redesign the post-visit communication workflow requires coordination across all three. Quarterly reviews create the accountability structure for those conversations to actually happen.
If your organization isn’t currently tracking all five consistently, start with First Pass Rate. It requires the least organizational coordination to implement, it moves the fastest, and it is the most direct feedback loop between your EHR and clearinghouse configuration choices and your revenue performance. Get that right first, and the rest of the metrics become much easier to optimize.
One final note: these metrics are only as good as the systems generating them. Ensure your EHR, clearinghouse, and billing platform are configured to report on these dimensions consistently and without manual aggregation. If pulling any of these numbers requires a multi-hour reporting project each week, that’s a configuration problem and fixing it is itself the first step toward operating with the visibility your organization needs.
Recent Posts

Common Pitfalls in Healthcare Billing and How to avoid them
Categories
Archives
- May 2026
- April 2026
- March 2026
- December 2025
- November 2025
- September 2025
- June 2025
- May 2025
- April 2025
- March 2025
- February 2025
- November 2024
- September 2024
- July 2024
- April 2024
- February 2024
- November 2023
- September 2023
- August 2023
- May 2023
- February 2023
- January 2023
- July 2022
- April 2022
- March 2022
- February 2022
- January 2022
- December 2021
- November 2021
- October 2021
- September 2021
- March 2021
- October 2020
- May 2020
Recent Comments